Editor’s note: Here is a blog post (with killer pictures) from one of our amazing team members, Krista West. Here’s a little bit about her:
Krista has been part of the remote sensing world for over a decade now. After earning her BS in Geography, she spent the summer interning at NASA Ames and worked in a team to create geo-visualizations of extreme storms in the Pacific Ocean. After that she worked at the Naval Postgraduate School (NPS) as a Research Associate. While at NPS, she earned an MS in Remote Sensing Intelligence, and then put that to good use as an Intelligence Specialist at Langley Air Force Base. Prior to joining the team at Intterra, she taught Introductory and Advanced Remote Sensing at the US Air Force Academy. Can you tell that she really enjoys the field of remote sensing?
Have you ever looked at something on the ground and wondered what it looks like from above? If so, you’re in luck! All of us at Intterra are working hard to ramp up our remote sensing products to better provide those views, as captured from spaceborne and airborne sensors. Use this blog post as a very basic introduction to remote sensing, and stay tuned for future posts that will continue to go deeper into the work we’re doing. You can skim through the definitions in the first part of the blog, but be sure to check out the awesome imagery toward the end.
What do I mean by Remote Sensing?
Remote sensing really refers to any method used to acquire information about something else without physically touching it.
Here’s the classic definition for my fellow nerds: The American Society of Photogrammetry and Remote Sensing (ASPRS) combined definition of Remote Sensing and Photogrammetry reads:
“… the art, science, and technology of obtaining reliable information about physical objects and the environment, through the process of recording, measuring, and interpreting imagery and digital representations of energy patterns derived from noncontact sensor systems.” (Colwell, 1997)
As a Remote Sensing Scientist, I have used remotely sensed data from space, drone data, and even data acquired from a distance of only a few inches from an object (using hand-held spectrometers and spectroradiometers). In the case of a wildfire, it is certainly my preference that we provide you with imagery that gives you additional intelligence about what you’re dealing with, rather than you having to go to any unnecessary risk to get that knowledge on the ground yourselves.
Um – What’s the difference between ‘Air Photos’ and Remotely Sensed Imagery?
You may be wondering – what is the difference between aerial imagery and remote sensing imagery, and why do I recommend use of remotely sensed images? Aerial imagery is collected by the visible parts of the electromagnetic spectrum (Red, Green, and Blue… or, to us folks in the know, “RGB”), so it “sees” what we would see with our own eyes. Remote sensing data collects RGB data, but goes even further by “looking” into other parts of the electromagnetic spectrum. Depending on the sensor, near infrared (NIR), shortwave infrared (SWIR), thermal infrared (TIR), and even more types of data can be captured. We can even incorporate RADAR (Radio Detection and Ranging) and LiDAR (Light Detection and Ranging) data. Below, you’ll see a figure that shows the electromagnetic spectrum. A sensor captures pieces of information throughout the electromagnetic spectrum, and we call each of those individual pieces a “band.” A sensor’s Blue band will generally span a distance anywhere between 400-500 nanometers (or 0.4-0.5 micrometers), a Green band goes between 500-600 nanometers (or 0.5-0.6 micrometers), a Red band can be between 600-700 nanometers (0.6-0.7 micrometers), and so on.

Figure 1. Image Source: NASA
What is the benefit of utilizing those extra bands beyond RGB? That additional data allows us to manipulate the imagery in such a way as to better highlight areas, or objects, of interest. For example, a common band combination – NIR, Red, and Green – is used to highlight healthy versus distressed, dead, or dying vegetation. If you’re wondering where to schedule a prescribed burn because trees have been decimated by mountain pine beetles, or if you want to make a note of particularly dry (and, therefore, fuel-filled) areas, then this is a useful product for you. Band combinations that include a SWIR band are excellent for highlighting hot spots and can also be used to calculate burn severity. If you want to know the exact location of an active fire, and you have satellite or drone data, this product will supply the information you need. Additionally, if you need to determine how severely the fire burned at an exact location, you can learn that from this product, too. In addition to collecting spectral information, we also gain geographic information from our products and can easily pinpoint the latitude and longitude of points of interest.
In the below examples, acquired on 19 and 25 July 2017 over the Detwiler Fire in California by the SPOT 6 and 7 sensors (respectively), the “true color” (RGB) image is on the left and the enhanced NIR image is on the right. The images on the right have bright red pixels to the east of the fire, and that tells us that there is very healthy vegetation present. The yellow/brown/gray pixels to the west of the fire represent very dry or dead vegetation, along with some areas of bare earth. It is also easier to see the fire perimeter with the band combination that produces the false color image.
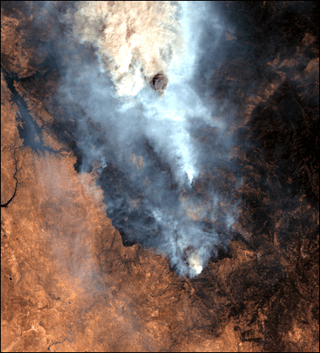
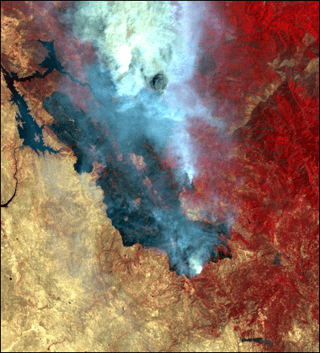
Figure 2. 19 July 2017 – Detwiler Fire – SPOT 6 – RGB: “True Color” (left) vs. NIR: “False Color” (right)
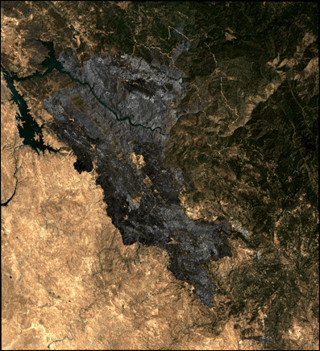
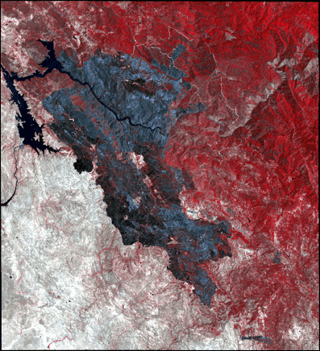
Figure 3. 25 July 2017 – Detwiler Fire – SPOT 7 – RGB: “True Color” (left) vs. NIR: “False Color” (right)
And, please keep in mind, we are not limited to only one new band combination; there are several options! Here are a few more examples over the Liberty Fire in Montana (acquired by Sentinel-2A on 23 July 2017) and the Sawmill Fire in Arizona (acquired by Sentinel-2A on 25 April 2017) below that
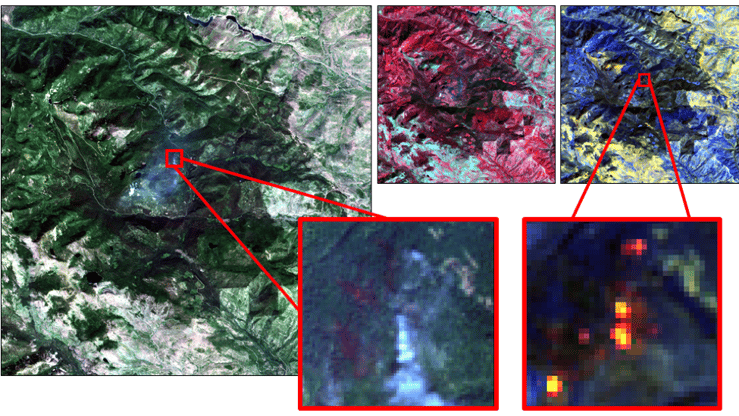
Figure 4. 23 July 2017 – Liberty Fire – Sentinel-2A
This figure shows three different band combinations over the Liberty Fire – RGB (far left), NIR (top, middle), and introduces a SWIR combination (top, right). To show the difference between an RGB image and SWIR image over a fire, refer to the zoom boxes with the red outlines. The RGB image (bottom, middle) shows smoke, but the SWIR image (bottom, right) shows the hot spots and “sees through” the smoke. We pulled all of this information from a single image file and would never be able to see all of this in just an aerial image.
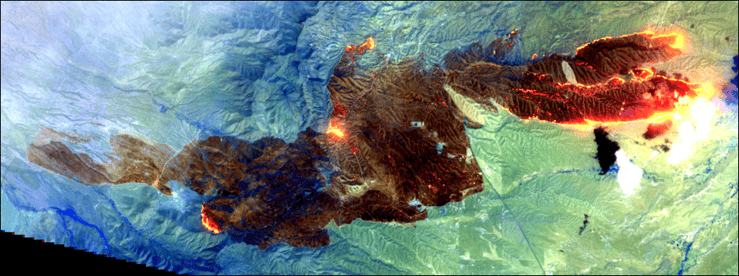
Figure 5. 25 April 2017 – Sawmill Fire – Sentinel-2A – SWIR: “False Color”
This stunning image of the Sawmill Fire incorporates SWIR bands. Not only is it easy to see the burned area, but you can clearly see the hot spots in several places along the perimeter.
So far, I’ve only shared satellite images, but imagery collected from Unmanned Aerial Vehicles (UAVs), or drones, is utilized in the field of remote sensing, too. A few of our customers have begun working with their own drones; others have been using Multi-Mission Aircraft (MMA) data captured by a sensor on an airplane.
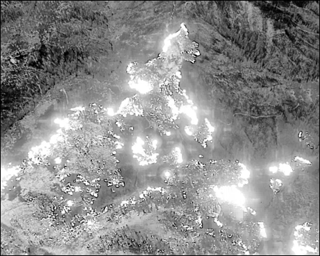
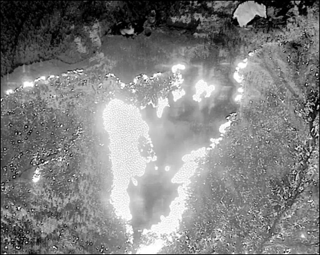
Figure 6. 17 August 2017 – Eclipse Complex Fire – MMA Collections – Infrared Imagery
Both of these images, acquired by the MMA over the Eclipse Complex Fire in Northern California on 17 August 2017, show active fires. In images like these, very bright pixels are indicative of something on the ground that is extremely hot (and, likewise, very dark pixels represent much cooler objects). In addition to still images, we are also able to provide short videos that alternate between aerial and IR footage.
Remote Sensing in Intterra
Your Intterra system can have two tools that incorporate remotely sensed image data – the Aircraft Intel Tool and the Satellite Intel Tool. As the tool names imply, the Aircraft Intel Tool will ingest and display imagery captured by drones/UAVs or sensors on aircraft (like the MMA), and the Satellite Intel Tool displays images captured by a variety of spaceborne sensors. Data products may include true and false color imagery and, in Air Intel, there may also be video clips. You can utilize this imagery to gain additional knowledge about an incident as viewed from above, whether you look at images as they are collected and added during the time of an incident, or if you want to look for fire retardant or hot spots identified by our in-house autoprocessor. To learn more about current capabilities of each tool, check out Aircraft Intel Tool and Satellite Intel Tool. We are, however, continuing to update these tools based on use cases that are constantly discussed among our team. Stay tuned!